Preprocessing data is everything in ML: Real-Time Curb Detection Using LiDAR
8.4.2025. 9 min read
ABSTRACT
This project explored real-time data transmission and processing for autonomous vehicle mapping using LiDAR. Kafka was used for data streaming, Redis for storage, OpenCV for image processing, and the model used for object detection was YOLOv8 with our heavily preprocessed custom training dataset. A producer-consumer system transmitted 3D vertex data, enabling the detection of curbs.
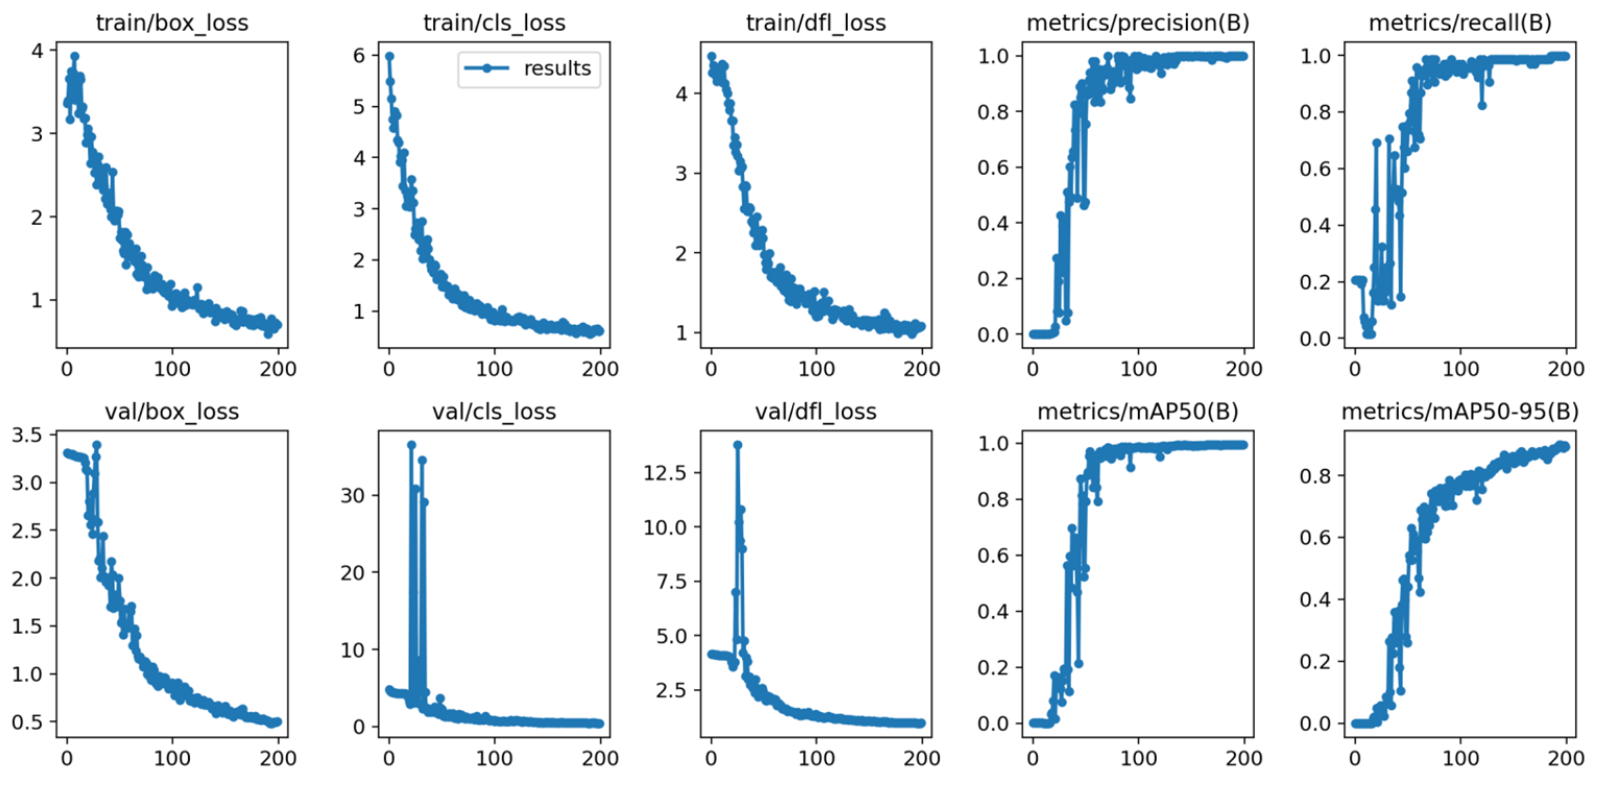
We achieved high accuracy after 300 epochs, though we had a lot of synchronization and slow rendering issues. We spent a lot of time optimizing visualisation algorithms with more efficient triangulation. The system effectively simulated LiDAR-based perception, demonstrating potential for autonomous applications, but requires optimization for speed and synchronization.
INTRO
As part of my research at the university, this project was a small cog in a bigger machine aimed at making driving safer. I was good at hardware, and I had a friend who was really into LiDAR at the time. We initially settled on using aerial photos from a drone I built back in 2020 (this exists..) alongside LiDAR, of course. The ultimate goal was to detect curbs with high accuracy.
What an interesting topic, right? Detecting goddamn curbs. In reality, it’s a vast, complex subject, especially if you’re into computer geometry. It involves tons of algorithms, notably Convex Hull and Triangulation.
But let’s start with the bigger picture. The biggest challenge was the constraint we faced with the iPhone. Our baseline was the minimum time it took for an iPhone to deliver a single scan. That scan produced a massive file of vertices that we would then process.
You can only imagine how “real-time” that felt. Obviously, “real-time system” is doing some heavy lifting here. The concept worked, though, for our demo, we used a prerecorded data stream that fully mimicked a real-time sensor. In comparison, fancy LiDAR devices output data at 10-20Hz, unlike this “one scan per eternity” claptrap.
REAL-TIME DATA TRANSMISSION
Let’s talk about how we achieved real-time data transmission. As previously mentioned, we use Kafka for streaming data and Redis for storing the data. If you’ve never used these technologies before, think of it as a pipeline where one part hands off the data to the other through a middleman, in this case, the middleman is Redis.
Let’s explain it with a practical example: The first end of the pipeline (called the Producer) captures LiDAR scans, splits them into individual frames, adds some metadata, and dumps it into Redis. Now, when the other end of the pipeline (called the Consumer) checks Redis for when a new frame is ready, it grabs that frame from Redis and displays it. Keep in mind that the Consumer is only here to display (and highlight) information, it is not doing any detection or processing. In our case, we draw bounding boxes on our height-mapped images.
Detection and processing is obviously done by our neural network. The NN is another subscriber to Kafka’s topic, which is basically a channel in Kafka’s messaging system that takes a frame, crunches the frame, creates a bounding box around the detected curb, and sends that data back to Redis.
All of this makes this system really robust, each part having its own role in the whole curb-detecting “ecosystem”. If you wanted a better way to display the data, update the Consumer, if you need a better detection model, swap the complete NN part. This is worth keeping in mind for any application you might have.
Producer → Kafka → NN → Redis → Consumer
PREPROCESSING DATA
I debated whether I should discuss this topic right at the start, or right at the end, because this is the most important bit: extracting the information from our LiDAR data clouds.
You start with a .obj file from a LiDAR scan, basically a bunch of 3D vertices floating in space. The Trimesh library was used to read those .obj files. Next, we went with an approach to turn those vertices into a grayscale height-map. We normalized the highest and lowest points to figure out distances, painting everything in shades of gray (this was important because the AI had to somehow discern where the curb is or isn’t).
To transform a 3D point cloud into a 2D height map, we conceptually positioned the camera along the z-axis, oriented to provide a top-down view of the scene. This approach involved aligning the virtual viewpoint directly above the point cloud, with the camera’s optical axis parallel to the z-axis (representing height), and subsequently adjusting its orientation to project the 3D coordinates onto the x-y plane.
To help you visualize this: Imagine you had a cloud of points in your favorite CAD software. With the camera tool, you select the top-down view, essentially removing the z-axis (in our case, our curb height). Now we have an x-y axis grid that we simply “paint” with gray tones, depending on how high or low something is on the z-axis, creating a grid where each point represents the height of that spot.
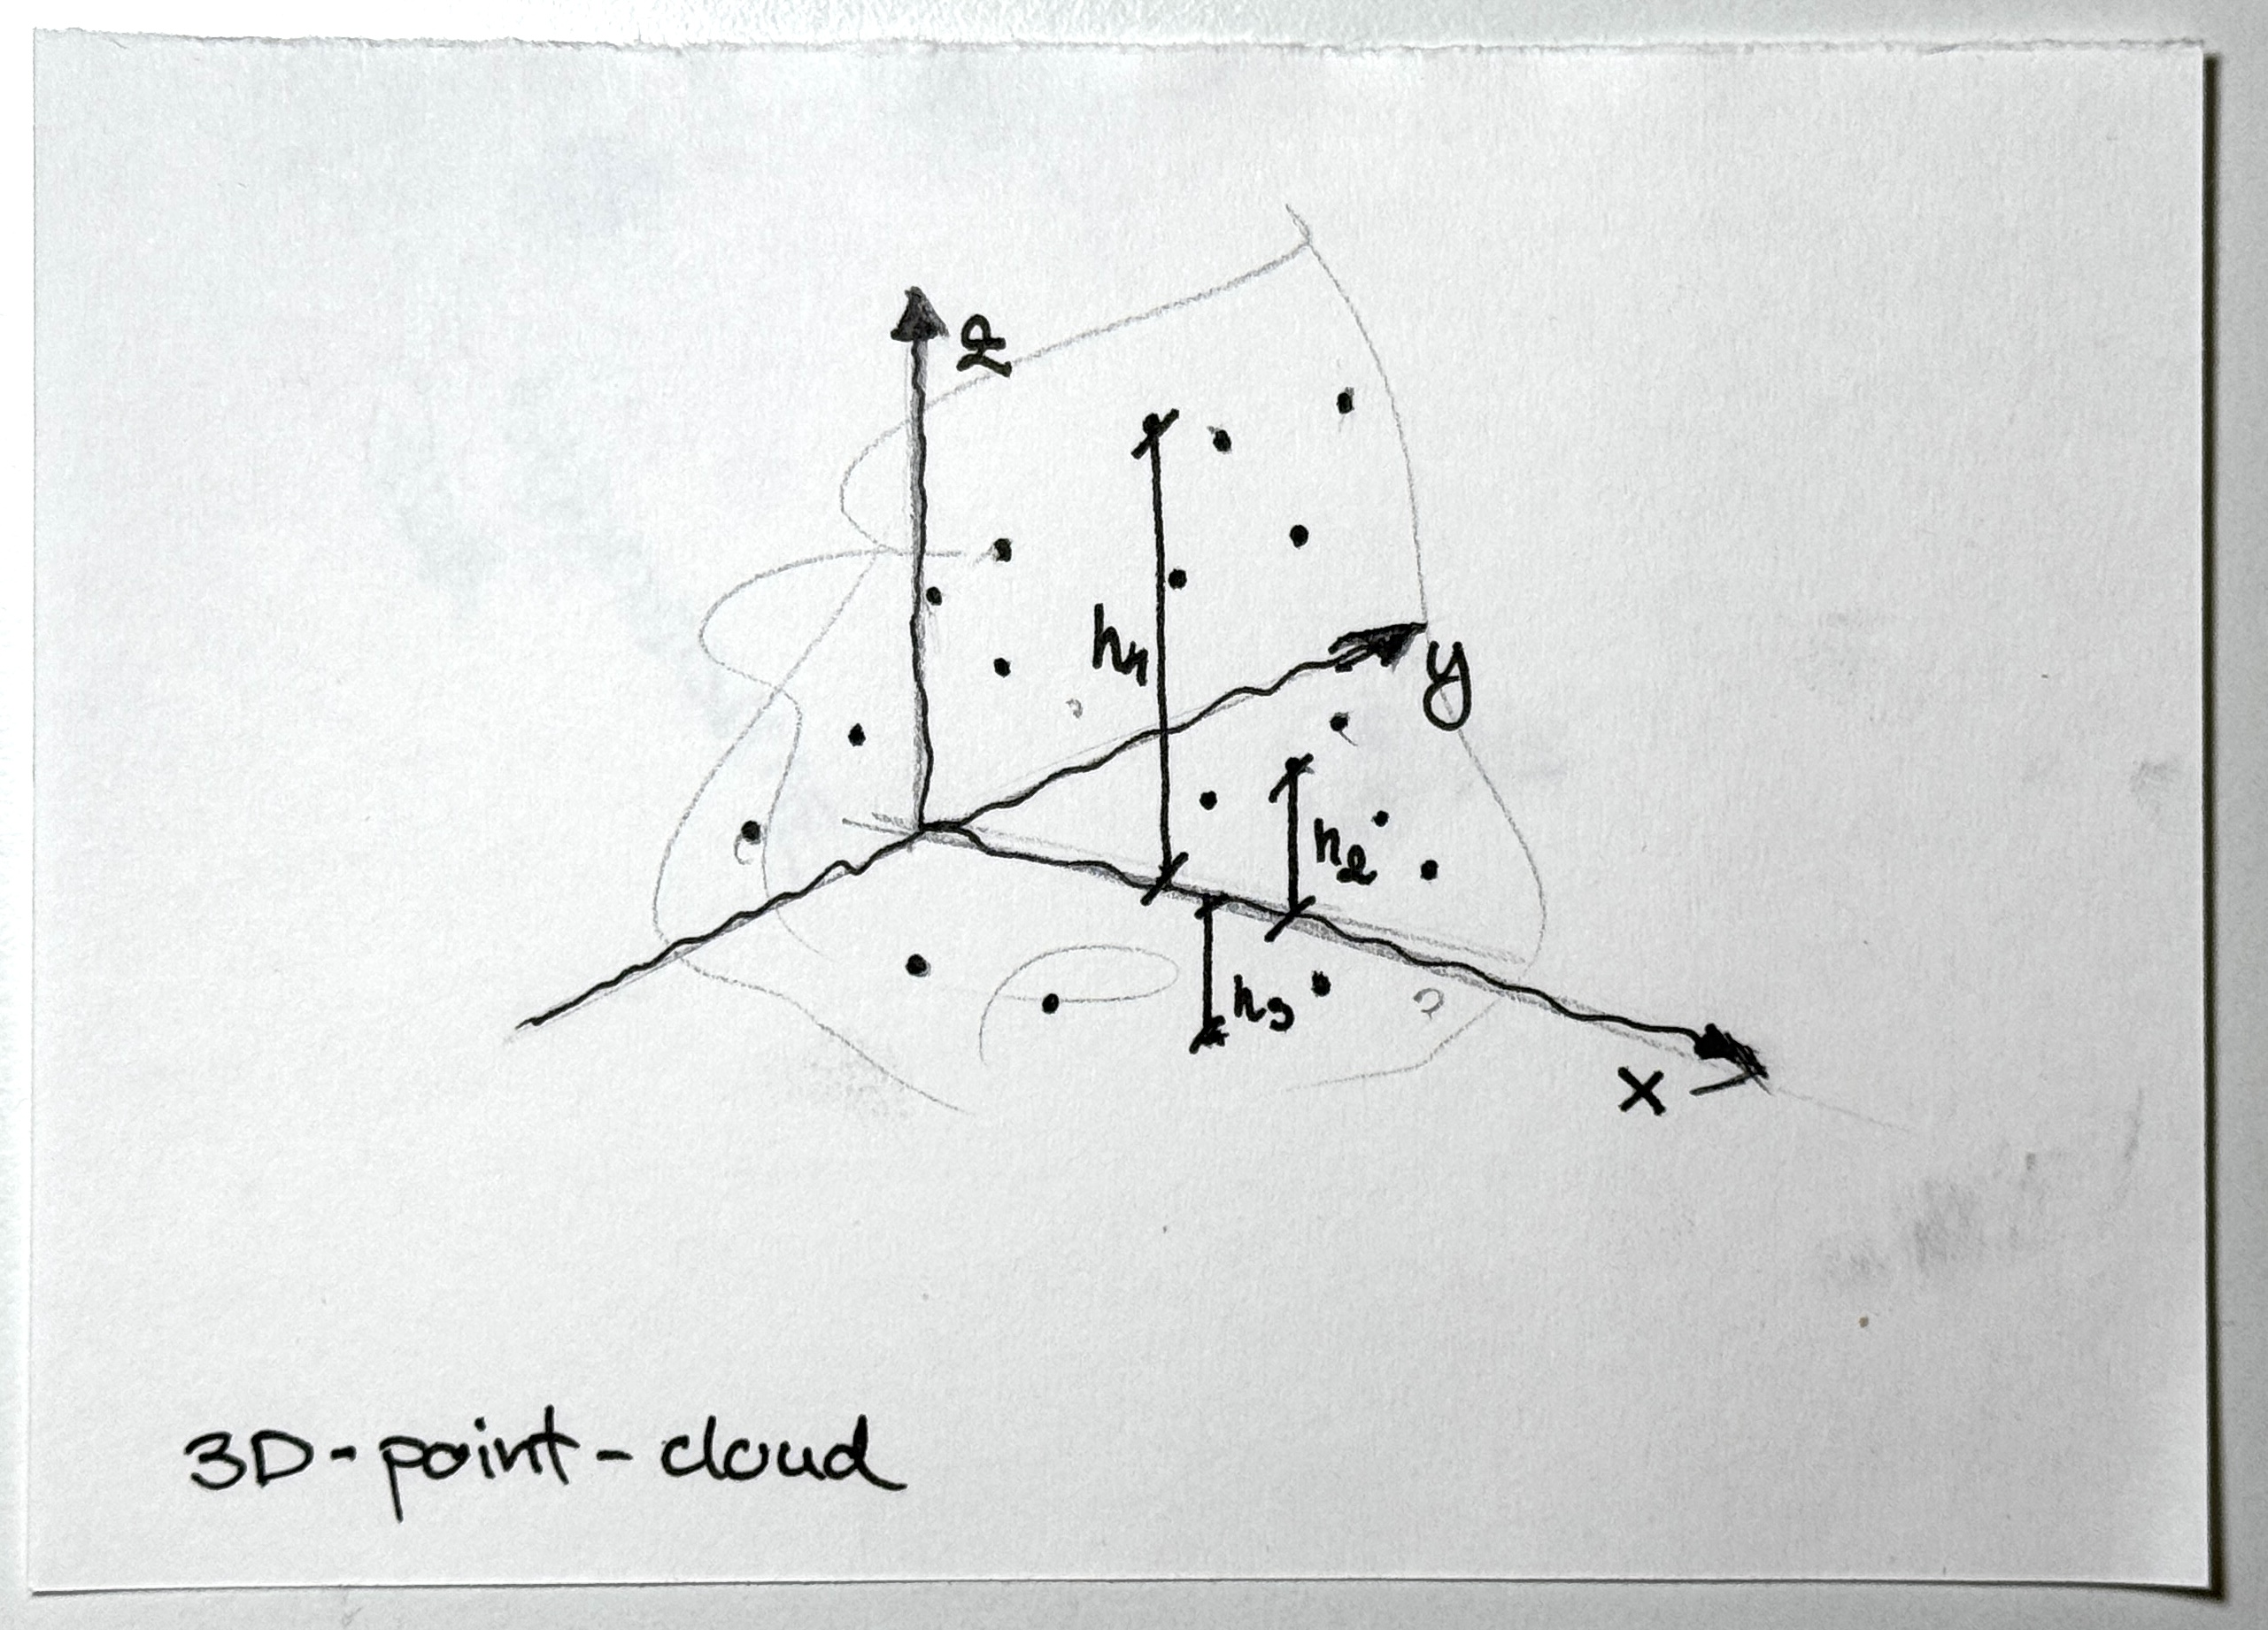
Raw LiDAR point cloud before processing
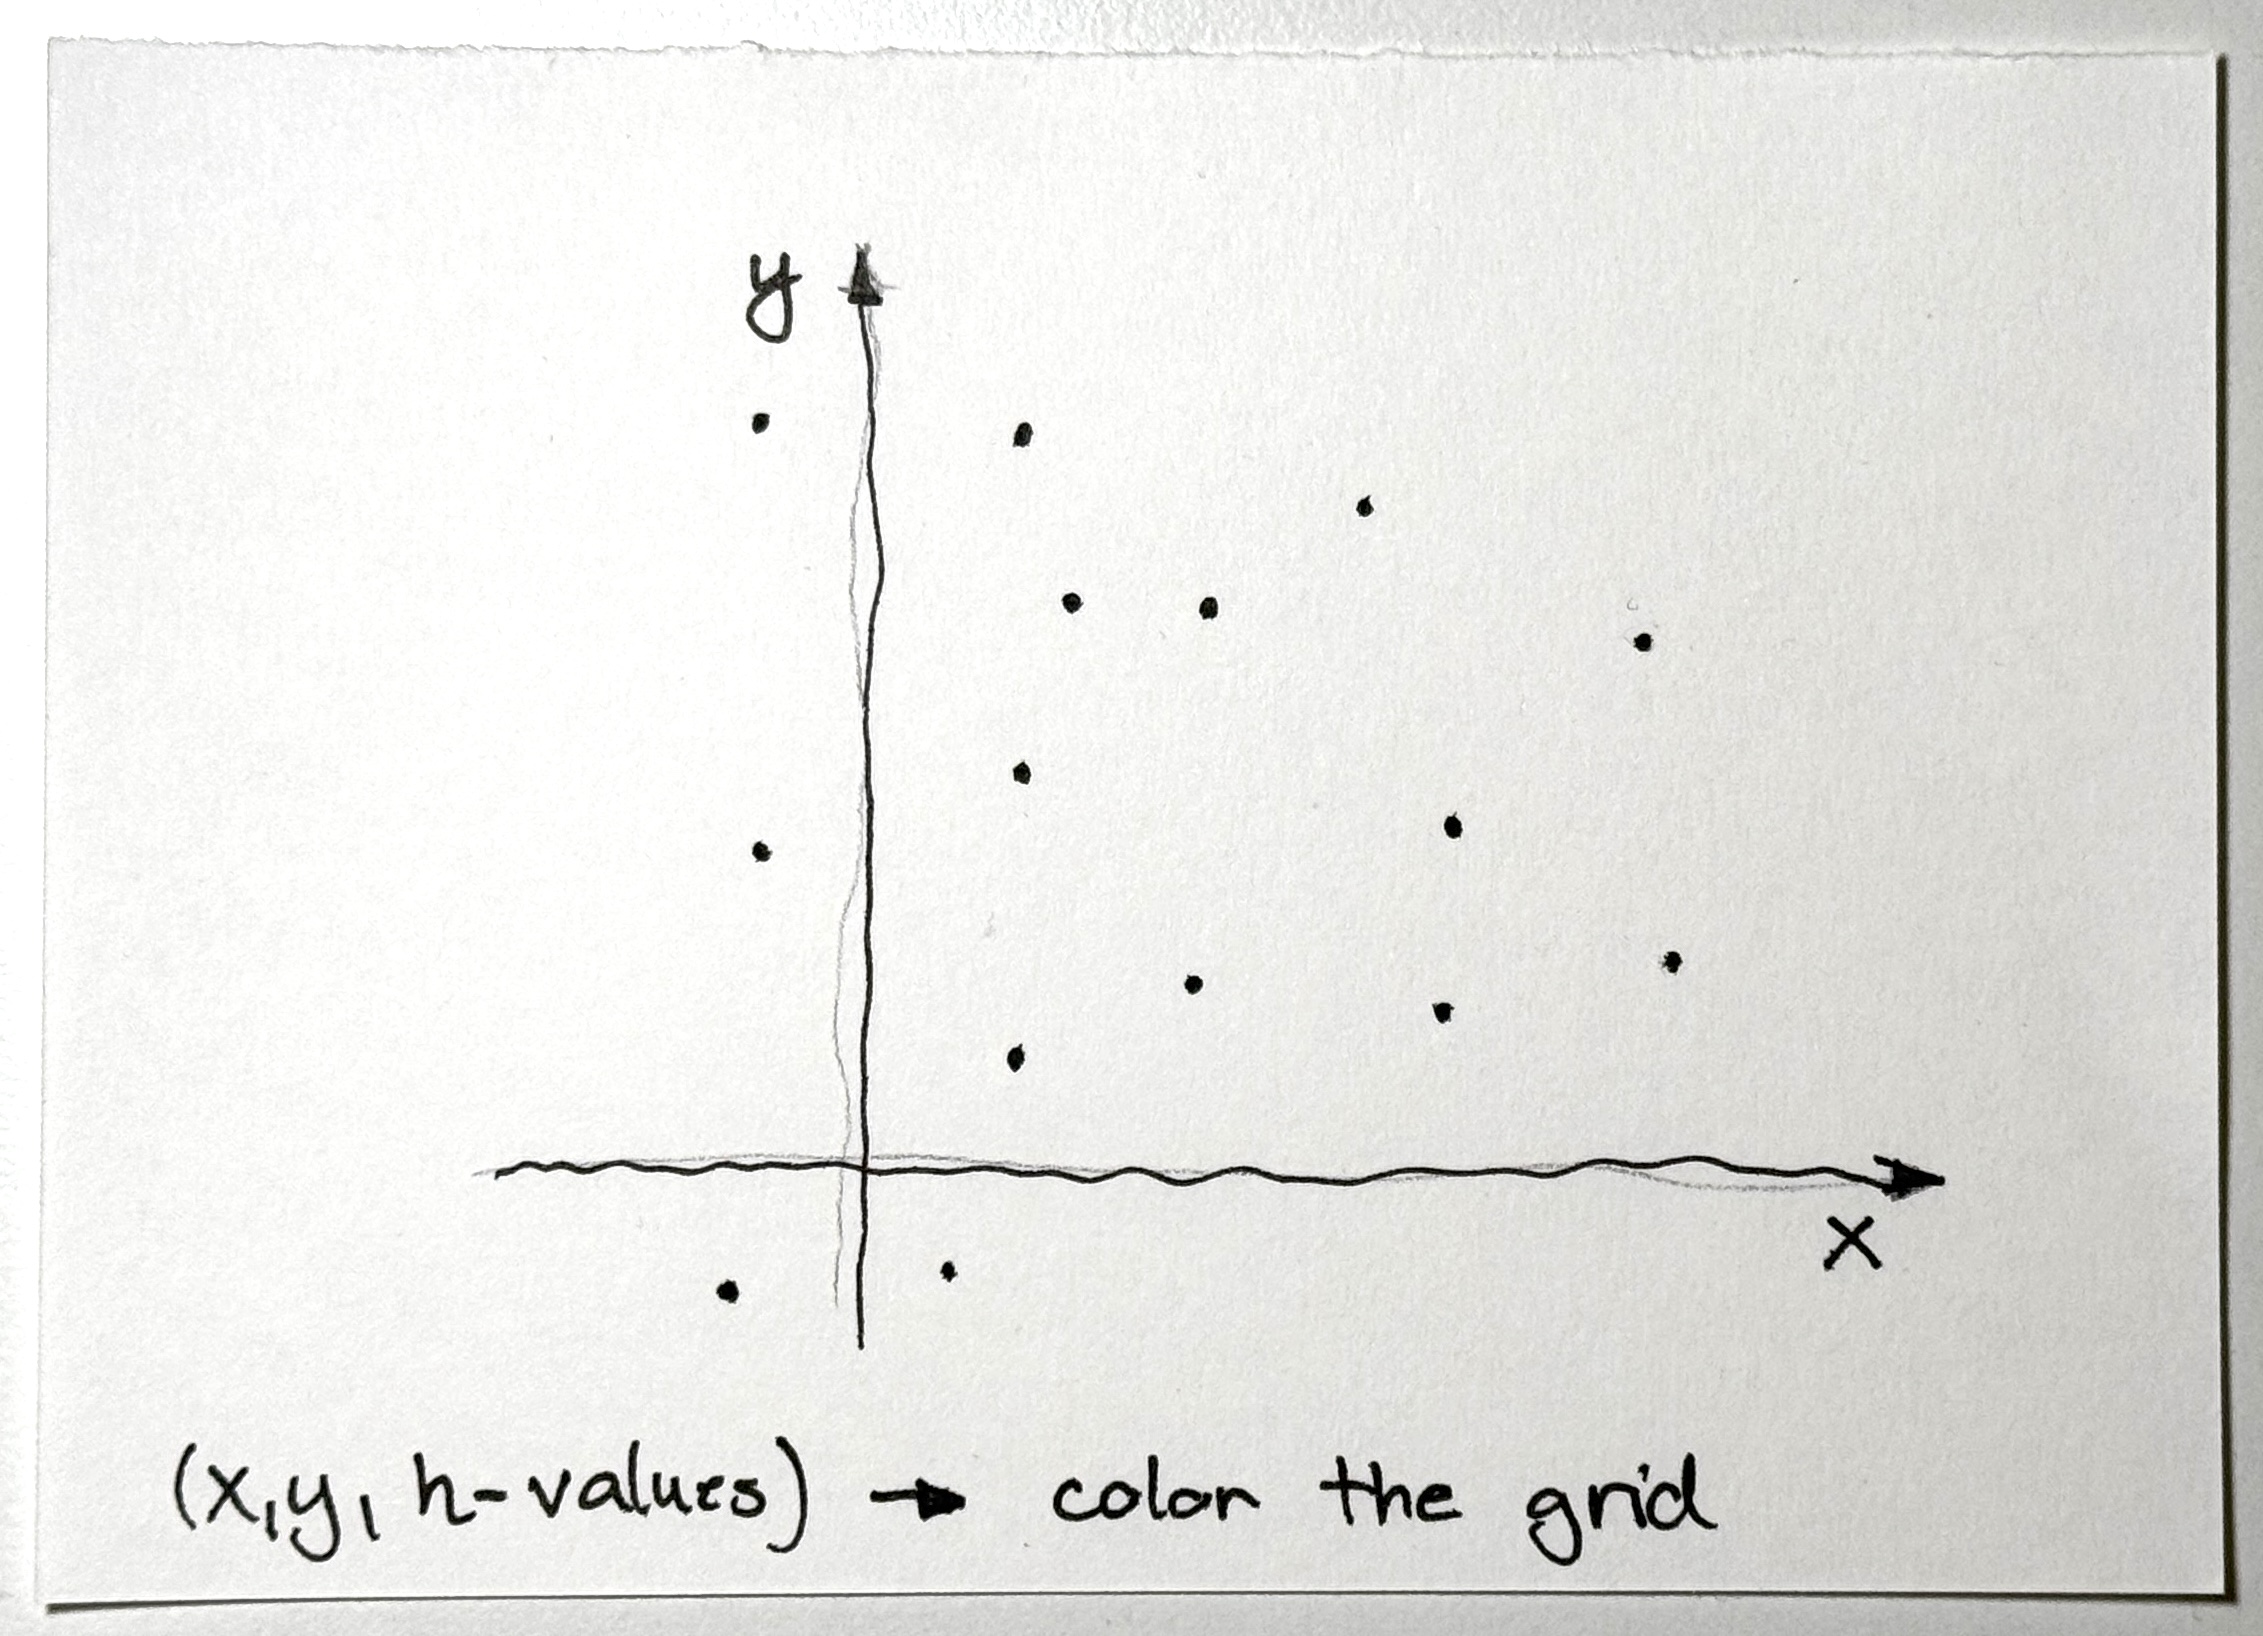
Oriented x-y plane (virtual camera parallel to z-axis)
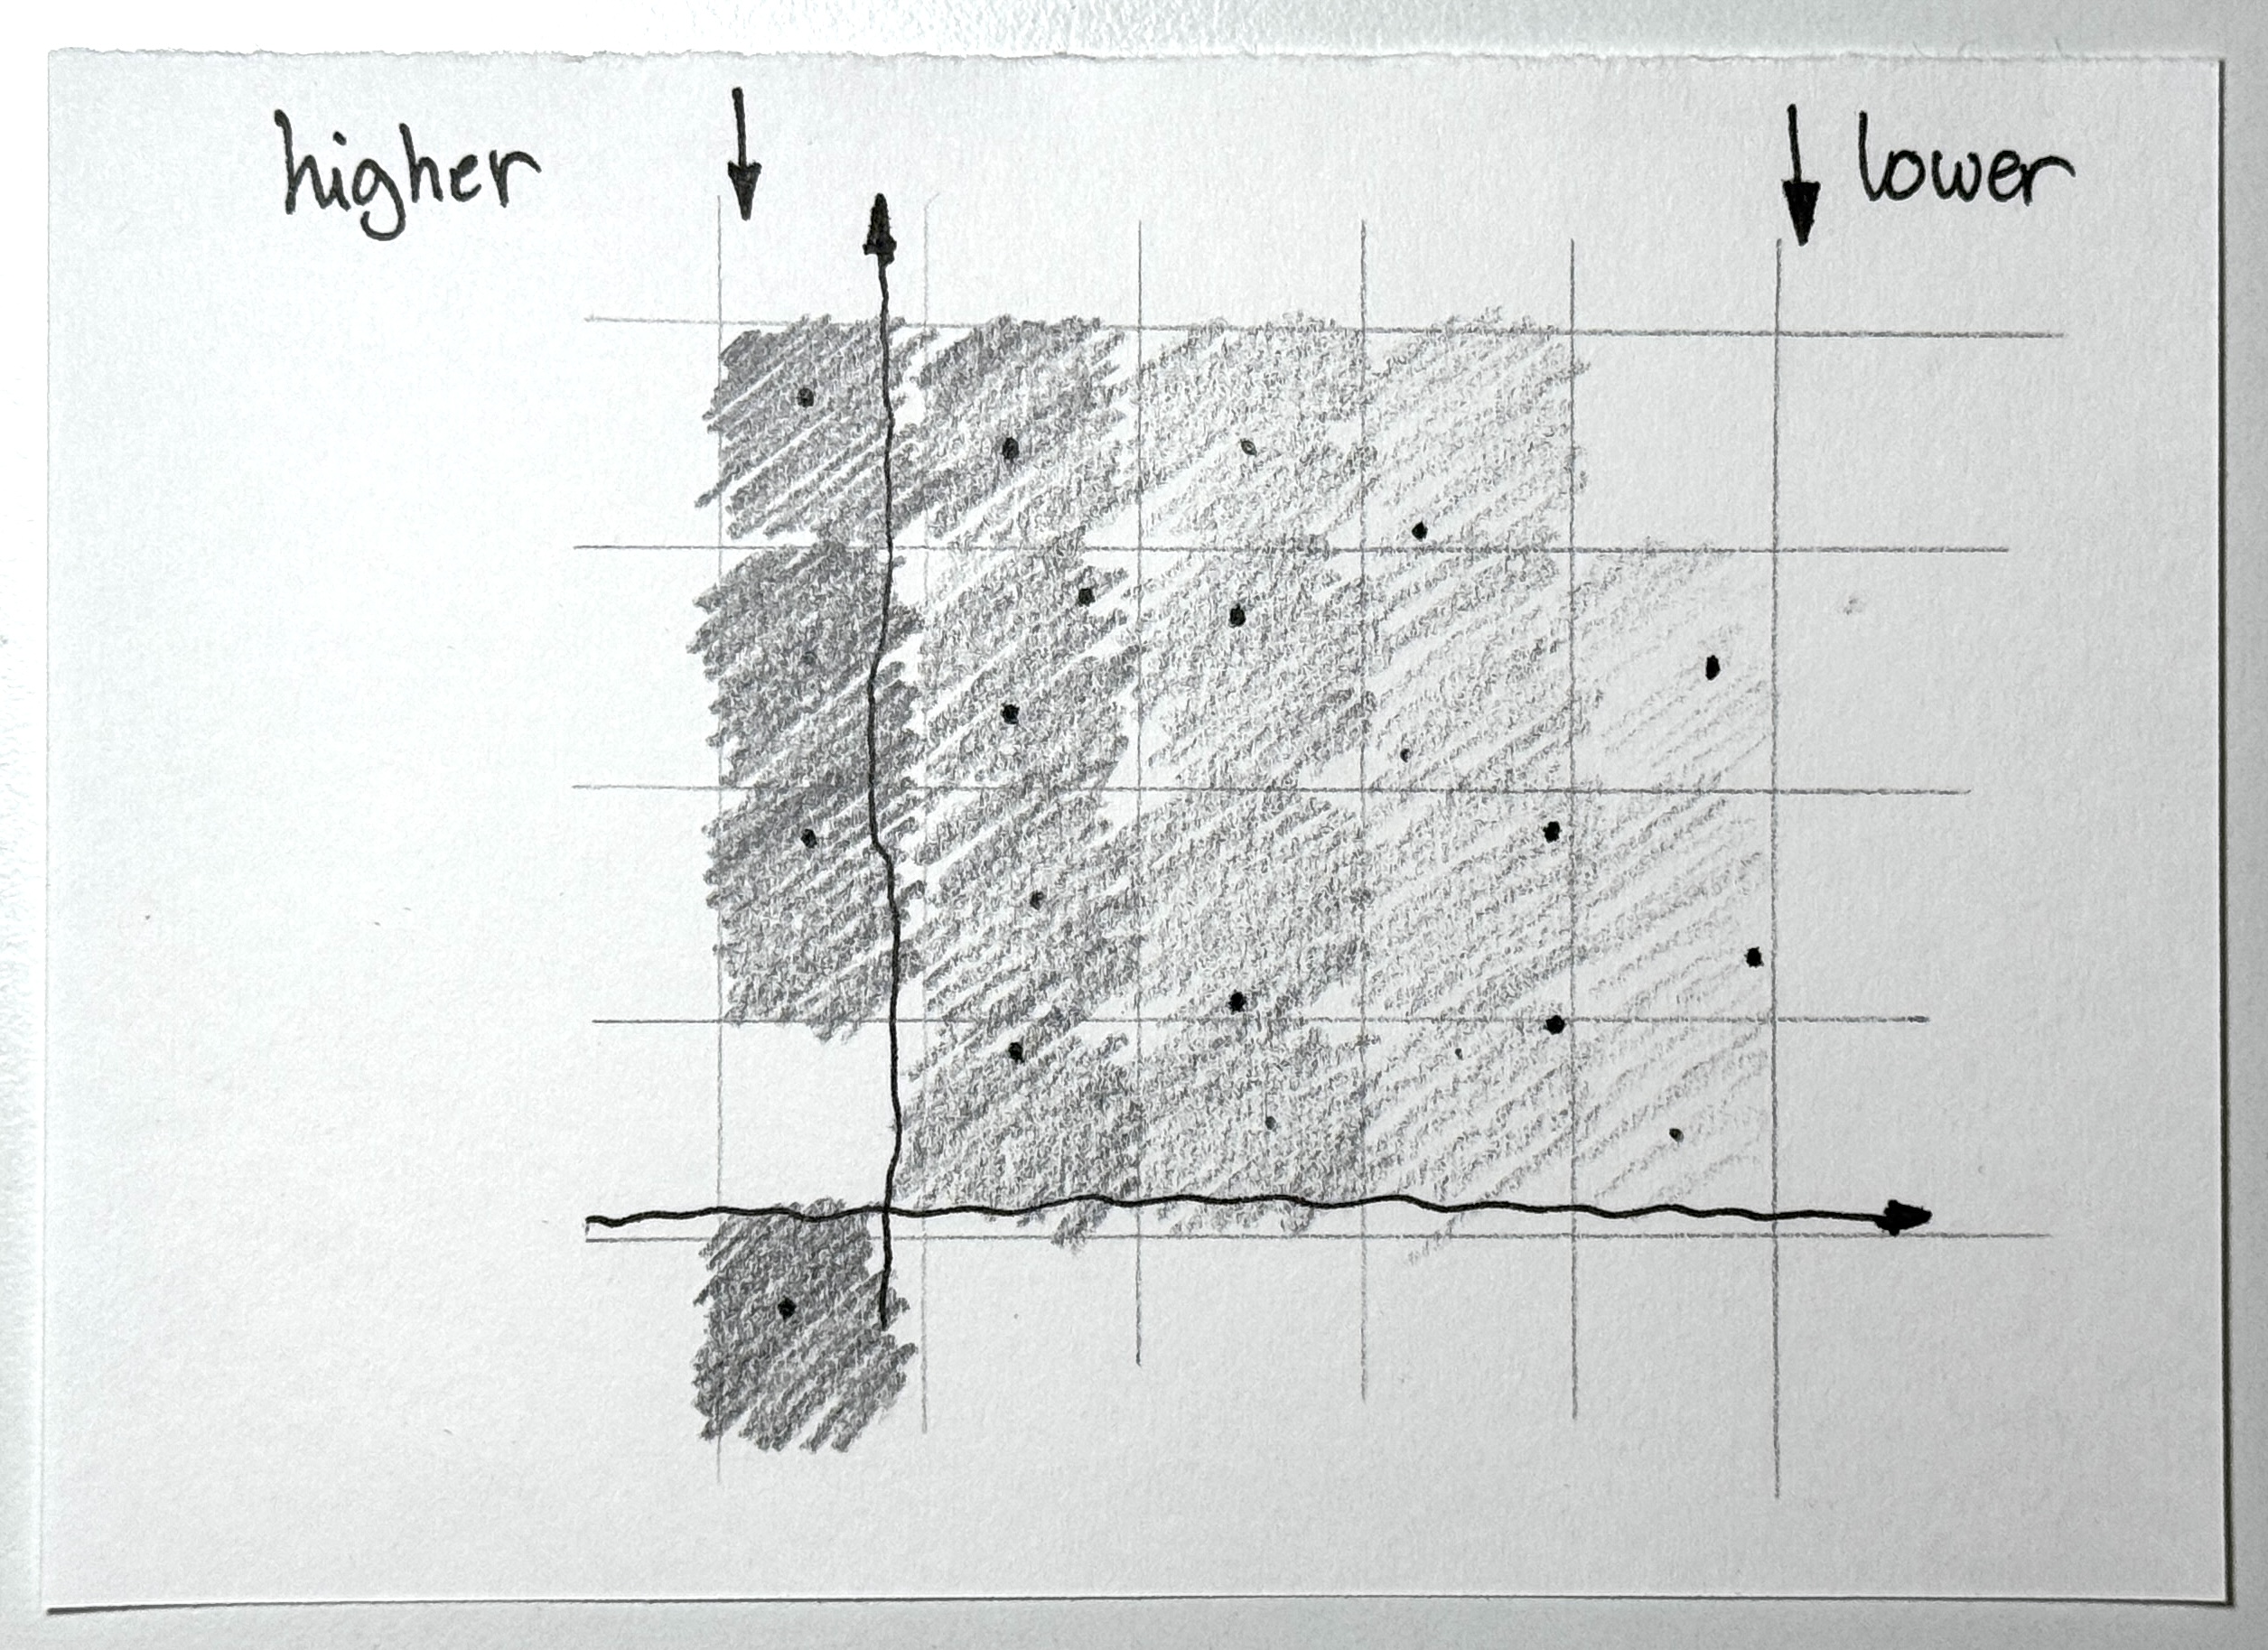
Grayscale height map generated from the point cloud
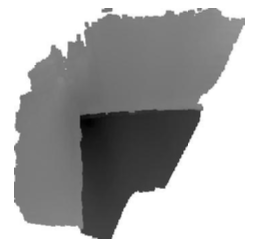
Result before further processing with 169887 vertices
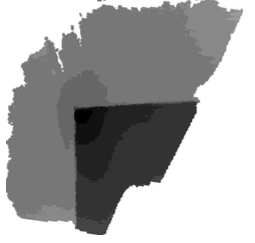
Final result after decimation resulting in 28849 vertices
Those generated frames were then filtered and altered with some heavy signal processing, but that’s a topic for another day:)
OUTRO
This whole thing was a showcase of how important data processing is before you even touch the ML part. Data dictates how well your model performs.
We sank a ton of time into picking the right tech for our use case. When we pitched the LiDAR idea to our mentors, they thought it was a long shot or improbable, really. But by the end, we didn’t just “proof-of-concept” it; we did it.
So, pay close attention to the tech you choose, and pay even closer attention to the data you feed your model. Picking the right tools and preprocessing is half the work in ML, maybe more. And as we’ve all heard already: “Sharpening the axe beats the hell out of chopping away with dull shit any day.”